|
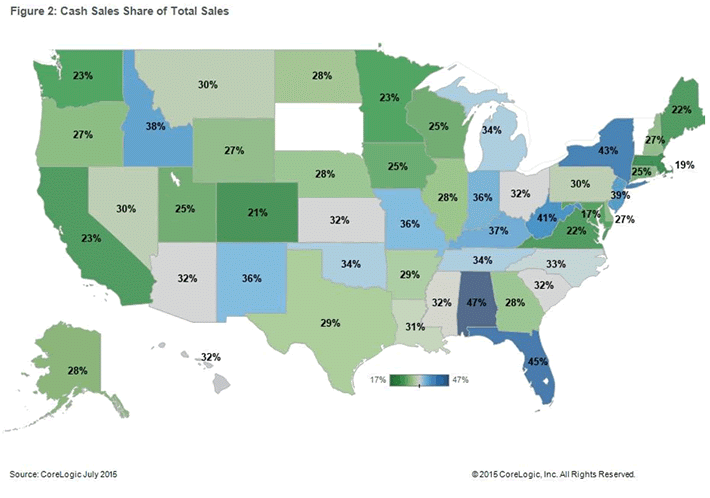
Cash Sales Share Drops to 9-year Low The year-over-year share has fallen each month since January 2013, and is at the lowest level in nine years. The cash sales share peaked in January 2011 when cash transactions made up 46.5% of total home sales nationally. Prior to the housing crisis, the cash sales share of total home sales averaged approximately 25%. If the cash sales share continues to fall at the same rate it did in July 2015, the share should hit 25% by mid-2017. Real estate-owned (REO) sales had the largest cash sales share in July 2015 at 56%. Resales had the next highest cash sales share at 30.2%, followed by short sales (28%) and newly constructed homes (15.6%). While the percentage of REO sales that were all-cash transactions remained high, REO transactions made up only 6.1% of all sales in July 2015. In January 2011 when the cash sales share was at its peak, REO sales made up 23.9% of total home sales. Resales typically make up the majority of home sales (about 83% in July 2015), and therefore have the biggest impact on the total cash sales share. The graphic below shows the cash sales share by state for July 2015.
Alabama had the largest share of any state at 47.4%, followed by Florida (44.7%), New York (42.8%), West Virginia (41.1%) and New Jersey (39.5%). Of the nation's largest 100 Core Based Statistical Areas (CBSAs) measured by population, West Palm Beach-Boca Raton-Delray Beach, Fla. had the highest cash sales share at 53.2%, followed by Miami-Miami Beach-Kendall, Fla. (52.2%), North Port-Sarasota-Bradenton, Fla. (50.1%), Fort Lauderdale-Pompano Beach-Deerfield Beach, Fla. (48.4%) and Cape Coral-Fort Myers, Fla. (47.9%). Washington-Arlington-Alexandria, D.C.-Va.-Md. had the lowest cash sales share at 13.6%.
|
| © 2006 - 2022. All Rights Reserved. |
