
|
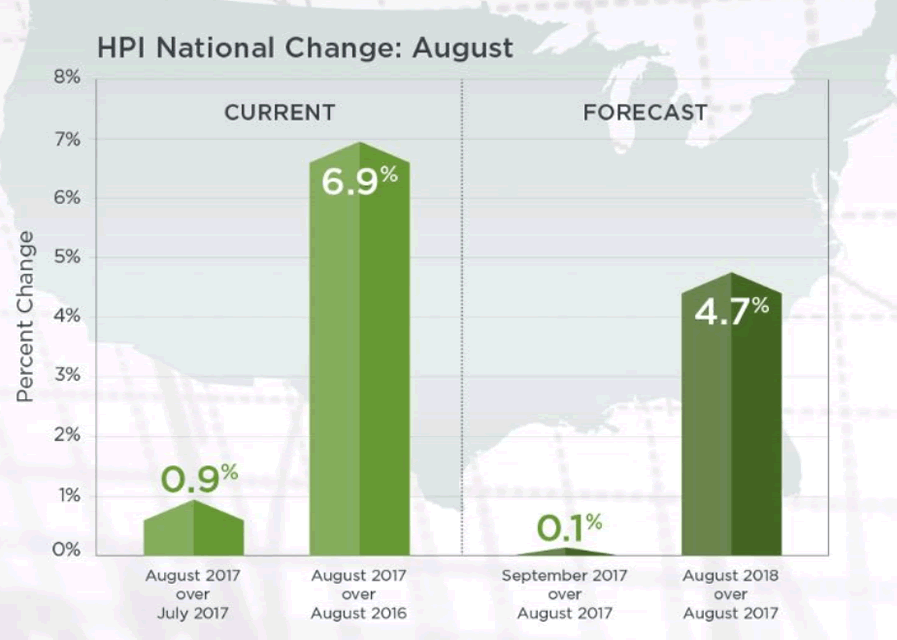
CoreLogic: House Prices up 6.9% Year-Over-Year in August Notes: The CoreLogic House Price Index report is for August. The CoreLogic HPI is a three month weighted average and is not seasonally adjusted (NSA).
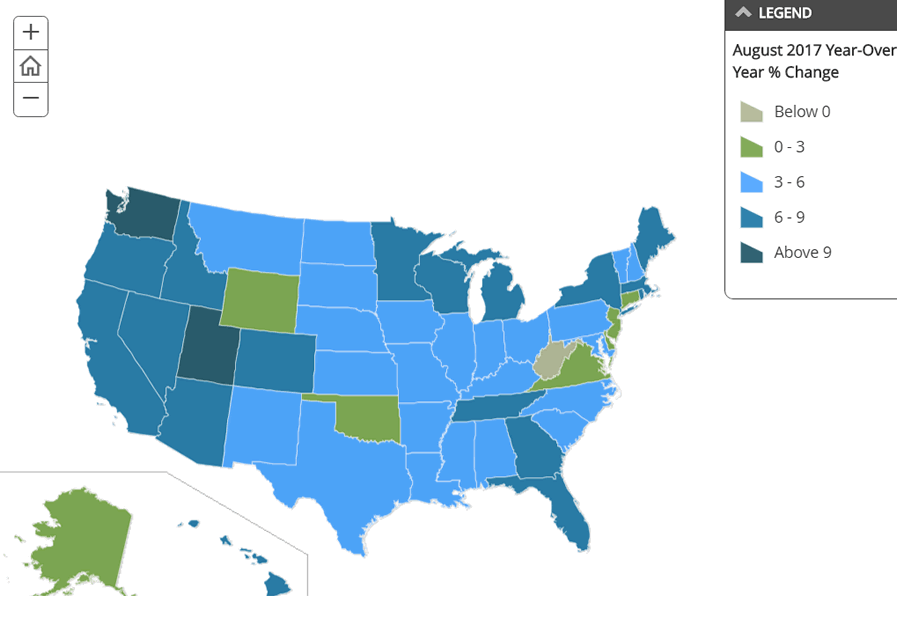
August National Home Prices Forecast Prices Nationally The CoreLogic HPI Forecast is a projection of home prices using the CoreLogic HPI and other economic variables. Values are derived from state-level forecasts by weighting indices according to the number of owner-occupied households for each state. While growth in home sales has stalled due to a lack of inventory during the last few months, the tight inventory has actually helped stabilize price growth,” said Dr. Frank Nothaft, chief economist for CoreLogic. “Over the last three years, price growth in the CoreLogic national index has been between 5 percent and 7 percent per year, and CoreLogic expects home prices to increase about 5 percent by this time next year.” The CoreLogic HPI provides measures for multiple market segments, referred to as tiers, based on property type, price, time between sales, loan type (conforming vs. non-conforming) and distressed sales. Broad national coverage is available from the national level down to ZIP Code, including non-disclosure states. Nationally, the year over year home price changed by 6.9 percent. Most states experienced increases, except West Virginia. The states with the highest increases were: Utah (11.2%) and Washington (13%) both experiencing double digit increases.
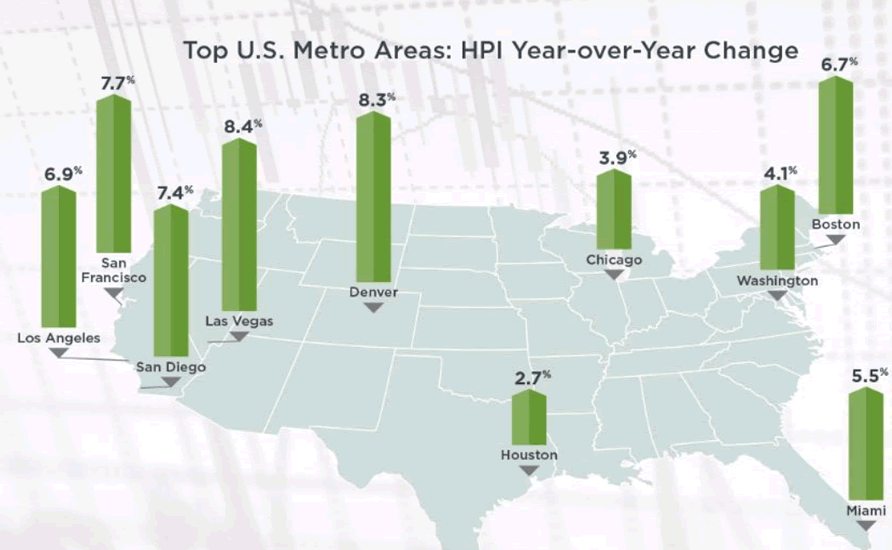
HPI Top 10 Metros Change These large cities continue to experience price increases with Las Vegas leading the way at 8.4 percent year over year.
|
| © 2006 - 2022. All Rights Reserved. |