|
Why I Moved from California to Florida by Bruce Norris Over 400 people attended our “Turmoil” seminar in Riverside on February 1st. We looked at all the California charts. Most are extremely positive. California has high affordability which should leave plenty of price movement on the upside. It has the lowest ratios of foreclosures to sales ever which should drive price increases. It also has a 50-year low unemployment rate that should support price increases, a building boom, and positive migration into California but none of that exists in today's California. In past cycles, these kinds of stats would equate to a California median price increase of 15%, strong in-migration, construction of 150,000 houses, and homes sales of over 500,000 in 2020 alone. None of that is going to happen. Here’s why. California Population Growth:
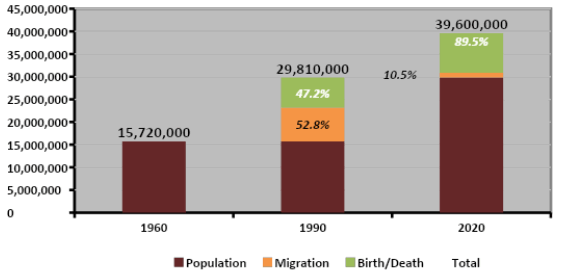
From 1960 to 1990, California grew by 14,190,000 (a 90% increase). From 1990 to 2020 (estimated), California grew by 9,690,000 (a 32% increase). Was there a difference in how California’s population grew and how significant is that? Yes. The population gains between 1960 and 1990 were driven by two engines; the number of births-over-deaths and the number of net positive people moving to our state called migration. Between 1960 and 1990, 52.8% of California’s growth was from migration. Here’s a good question: Which type of population gain would a state rather have? Positives about migration (both immigration and domestic migration):
Between 1990 and 2020 (est.), California had a 9,690,000 gain in population. Unlike 1960 to 1990, 89.5% of California’s population gains were from births over deaths! This is very significant and an explanation of why California prices have had trouble moving up with the best set of charts in our lifetimes. Think About the Difference
What percent of California’s population growth in the last 30 years can afford to buy a median priced home?
Many know, I’ve been exchanging most of my California rental assets into Florida and buying new Florida houses as rentals. We’ve been helping our network do the same over the past year. So, how does Florida Compare?
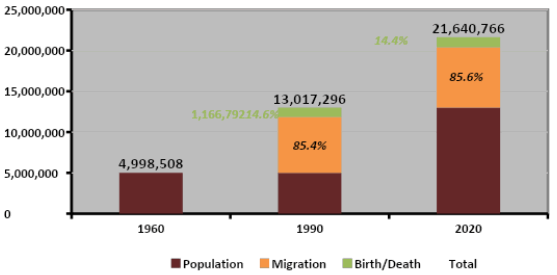
California nearly doubled in population from 1960-1990 (90% increase), Florida increased 160%. From 1990-2020, California increased 33% while Florida grew 66%. However, it’s the makeup of the growth that is the most significant. While California’s growth is almost 90% birth over death, Florida continues to attract 85% of its population growth via migration. The Florida chart is the Reverse of the California chart. That is a Very Big Deal! The population of Florida in 2020 is at around 22,000,000 with a growth rate of about 1.6% expected between 2021-2030. With an estimated total gain of 3,530,000, that’s a 16% gain in population.
California numbers for 2019 just came out. The population gain is 141,310:
Migration did not contribute to the population in 2019 and I think there’s a good case to conclude that will be the trend for the entire decade between 2020 and 2030. In the next decade, Florida will get 93% of its population gain from migrating adults. That means Florida will gain about 16% in population over the next decade, mostly households!
Florida’s future charts look exactly like California’s boom years. California’s price boomed to double the national average because it averaged 300,000 net migration for over two decades. Florida will now be winning that battle for decades to come. Game changer.
Bruce Norris is an active investor, hard-money lender and real estate educator. A talk show host in his hometown of Riverside, Calif., Norris is a frequently quoted in financial publications and a speaker at investor club meetings throughout California. His latest study, The California Comeback 2, was released in July 2013 and provides the statistics that substantiate his predictions. More information about Bruce Norris, his research and his investment seminars are available at www.thenorrisgroup.com.
|
| © 2006 - 2022. All Rights Reserved. |

