
|
April Home Sales Gain But Year-to-Date Sales Lowest Since 2008 California single-family home and condominium sales in April 2014 were up 20.0 percent for the month but were down 13.3 percent from April 2013. Despite April gains, year-to-date sales volume was at its lowest level since 2008. For the month, both distressed and non-distressed property sales posted gains. April 2014 distressed property sales gained 13.1 percent from March, while non-distressed property sales were up 21.8 percent. “Despite back-to-back double digit sales gains in both March and April, total sales volume since January continues to lag sales in 2013,” said Madeline Schnapp, Director of Economic Research for PropertyRadar. “In fact, what is surprising to me is that year-to-date sales are the lowest since 2008.” The April 2014 median price of a California home hit its highest level in six years, rising 7,500 dollars, or 2.0 percent, to 376,500 dollars from 369,000 dollars in March. On a year-ago basis, median home prices jumped 14.1 percent. Driving the month-over-month price increase in April was a 21.8 percent increase in the sales volume of higher priced non-distressed properties. “Despite lower sales volume, the median price of a California home continues to march higher,” said Schnapp. “The rise in median home prices is being driven by the change in mix between the sales of distressed properties versus sales of non-distressed properties. Higher priced non-distressed property sales now dominate monthly sales numbers, so it should come as no surprise that median prices are up.” In other California housing news:
“While most real estate analysts are forecasting a robust real estate recovery for the rest of 2014, our data suggests anemic sales growth,” said Schnapp. “Elevated negative equity, high prices and low inventory are depressing sales volumes and crowding out potential buyers.”
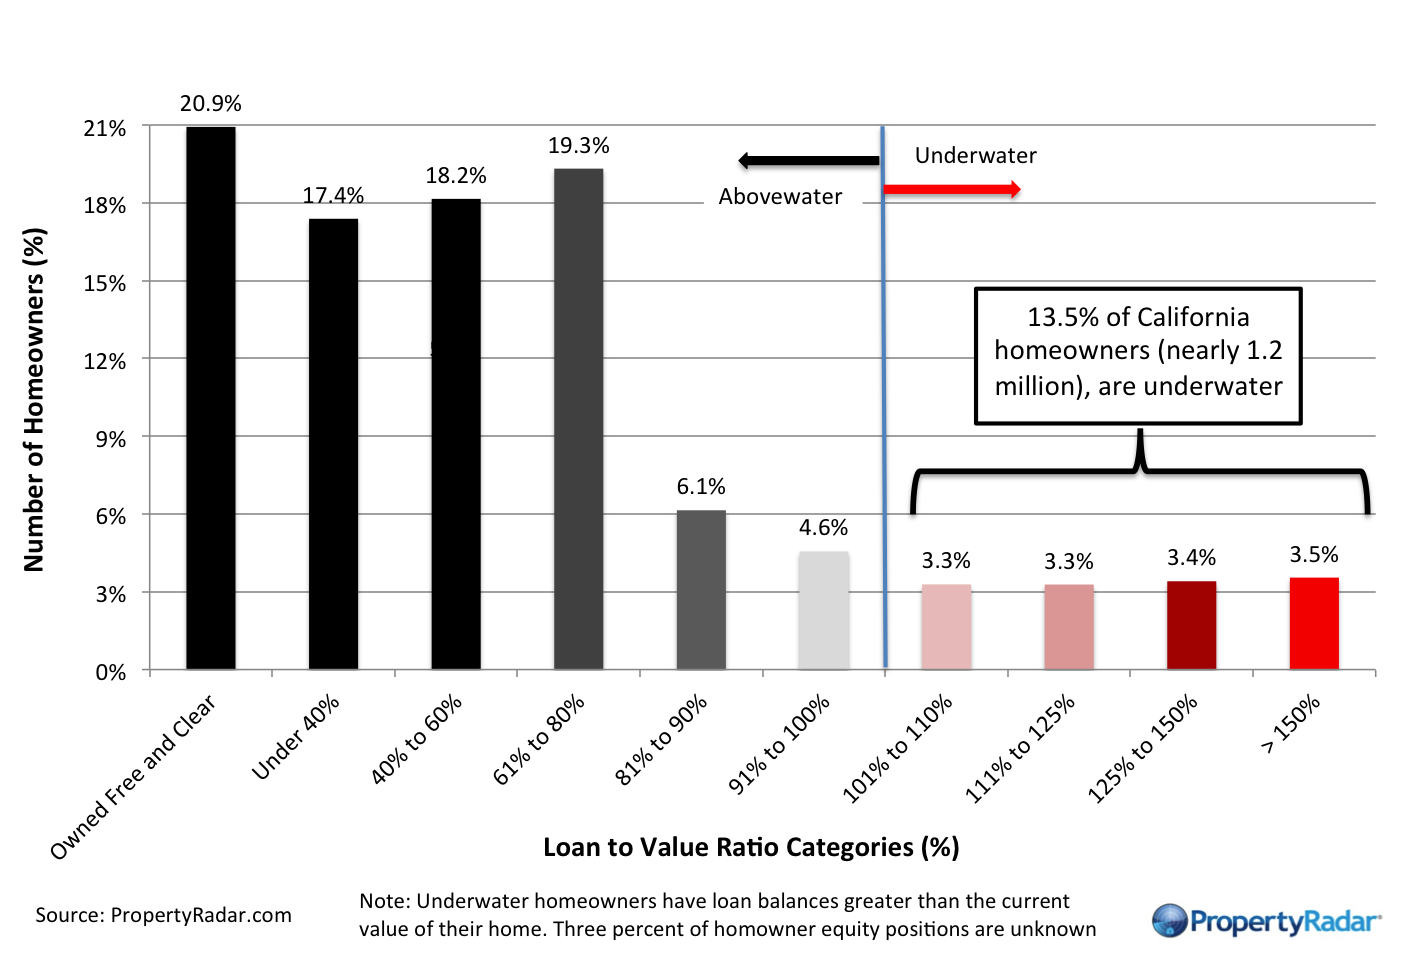
California Homeowner Equity
California Home Owner Equity – A model estimate of California homeowners segregated into various categories of levels of homeowner equity for a given month. Homeowner numbers represent a percentage of total California homeowners.
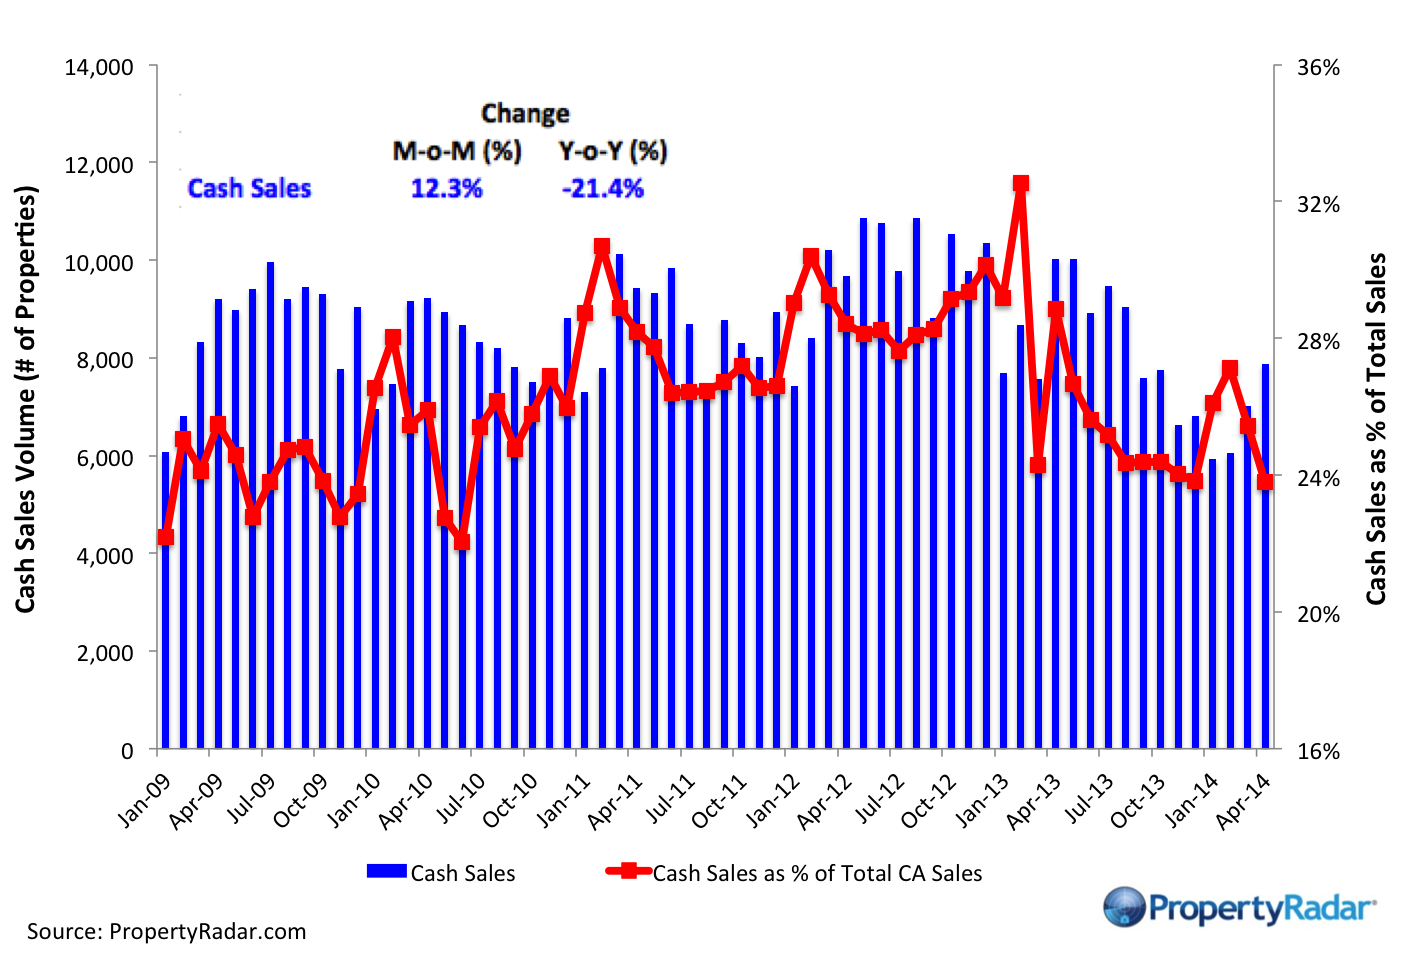
Cash Sales
Cash Sales – The blue bars (right axis) illustrate cash sales of single-family residences and condominiums by month. The red line (left axis) illustrates cash sales as a percentage of total sales by month.
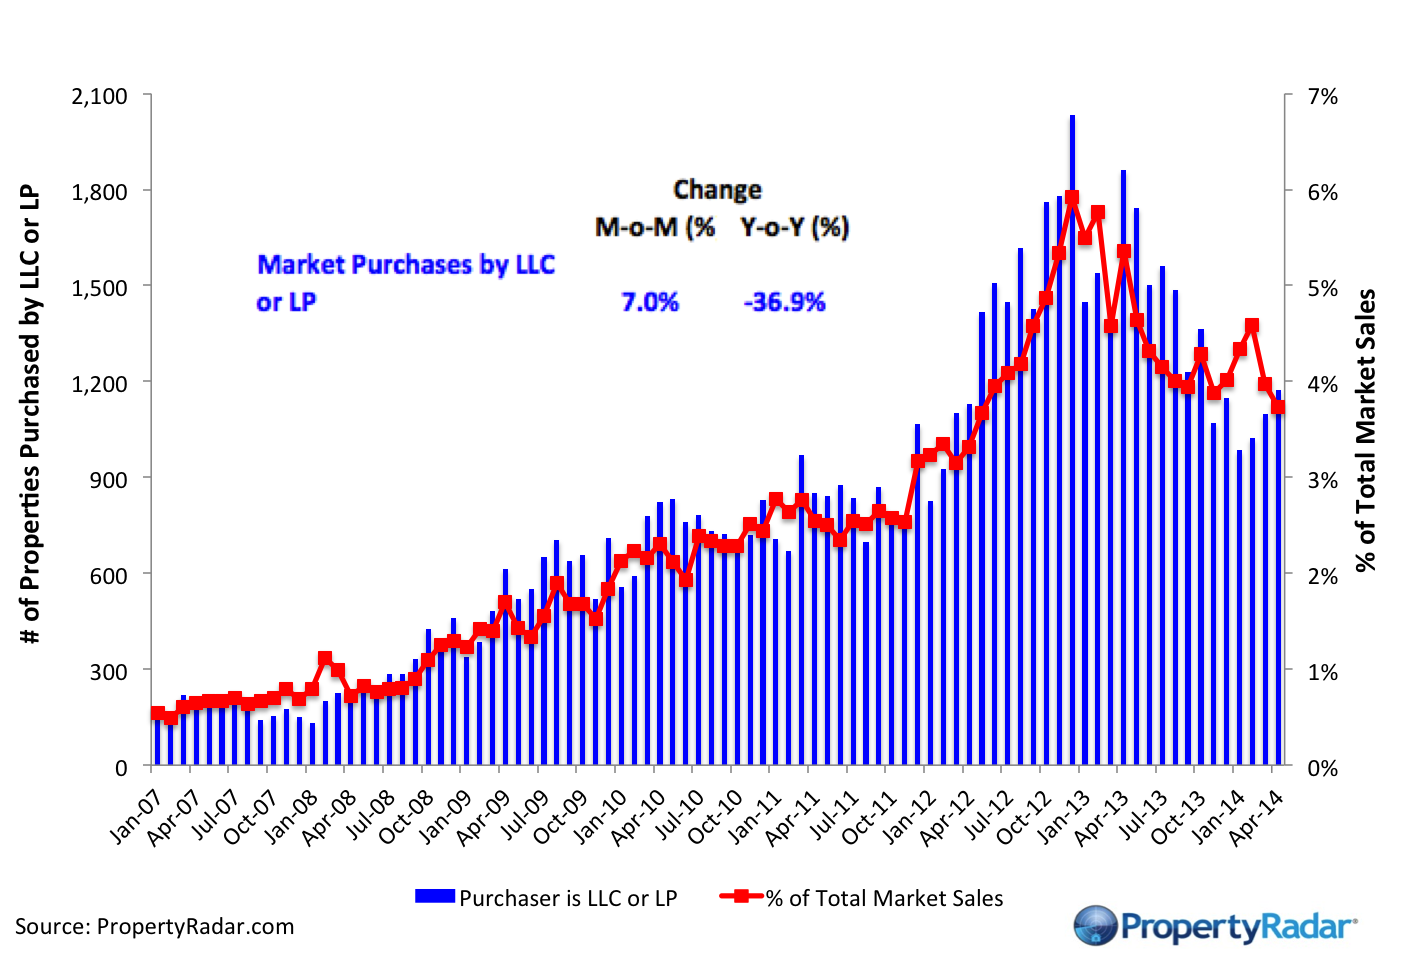
Market Purchases by LLCs and LPs
Market Purchases by LLCs and LPs – The blue bars (right axis) illustrate market purchases of single family residences and condominiums by LLCs and LPs from 2007 to current. The red line graph (left axis) illustrates LLC and LP purchases as a percentage of total sales by month.
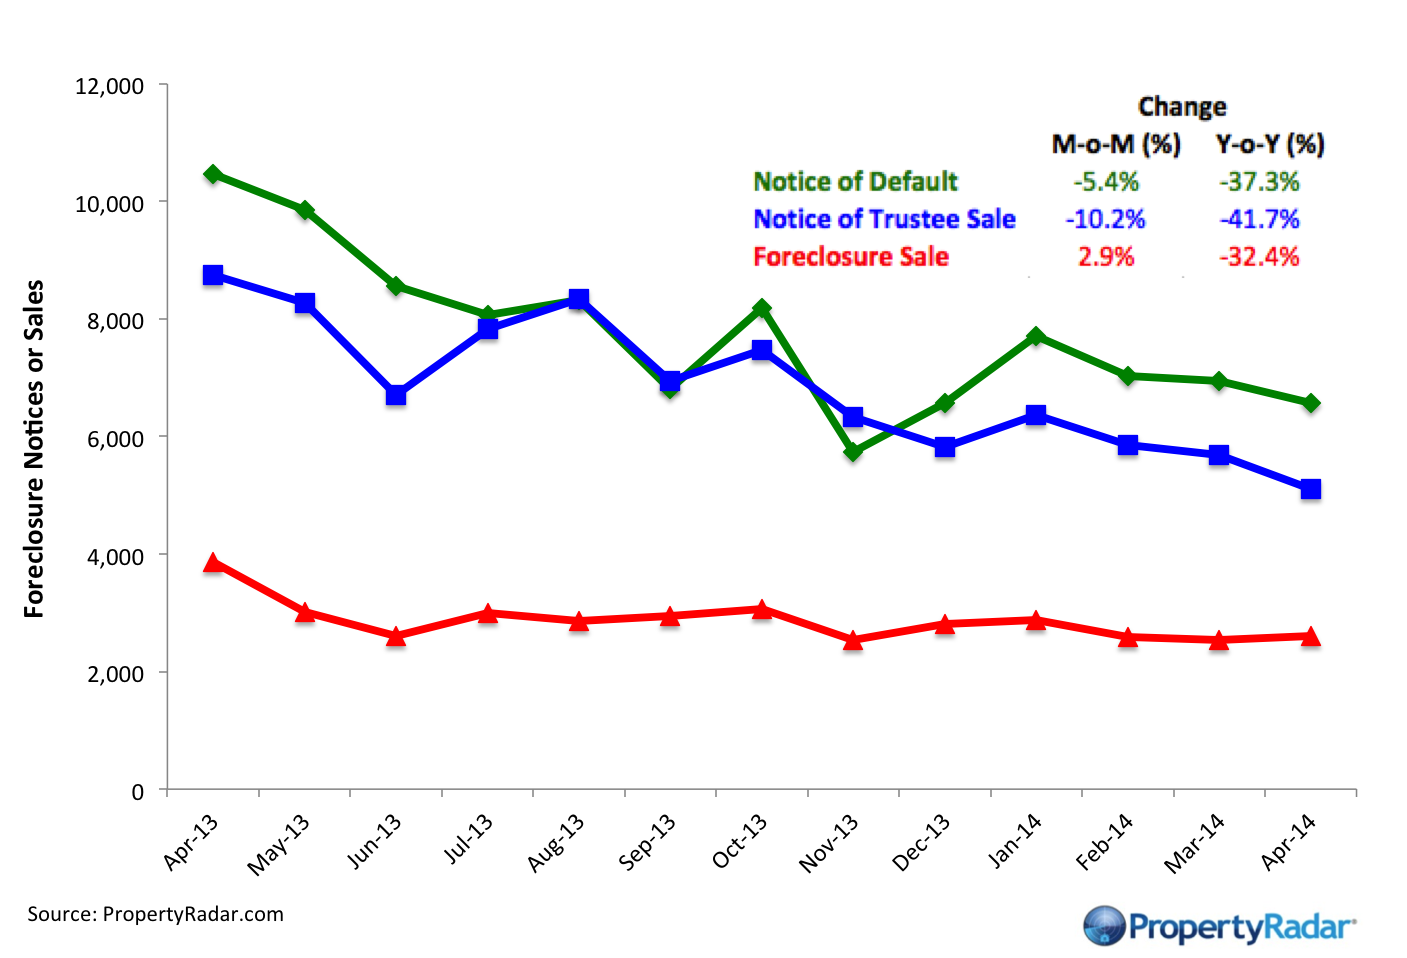
Foreclosure Notices and Sales
Foreclosure Notices and Sales – Properties that have received foreclosure notices — Notice of Default (green) or Notice of Trustee Sale (blue) — or have been sold at a foreclosure auction (red) by month.
|
| © 2006 - 2022. All Rights Reserved. |