
|
CoreLogic Reports March Home Prices Increased by 3.7% Year Over Year
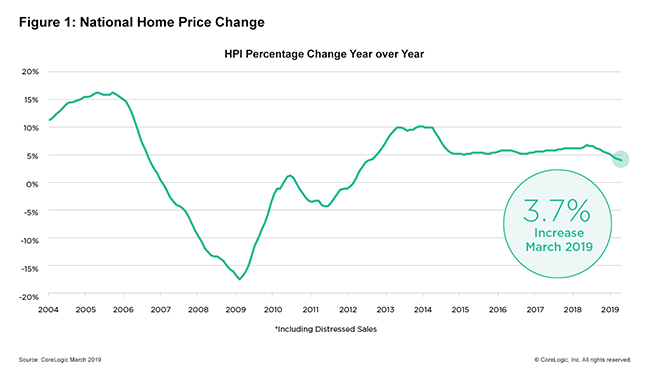
CoreLogic today released the CoreLogic Home Price Index (HPI™) and HPI Forecast™ for March 2019, which shows home prices rose both year over year and month over month. Home prices increased nationally by 3.7% year over year from March 2018. On a month-over-month basis, prices increased by 1% in March 2019. (February 2019 data was revised.)
Looking ahead, after some initial moderation in early 2019, the CoreLogic HPI Forecast indicates home prices will begin to pick up and increase by 4.8% on a year-over-year basis from March 2019 to March 2020. On a month-over-month basis, home prices are expected to decrease by 0.3% from March 2019 to April 2019. The CoreLogic HPI Forecast is a projection of home prices calculated using the CoreLogic HPI and other economic variables. Values are derived from state-level forecasts by weighting indices according to the number of owner-occupied households for each state. “The U.S. housing market continues to cool, primarily due to some of our priciest markets moving into frigid waters,” said Dr. Ralph McLaughlin, deputy chief economist at CoreLogic. “But the broader market looks more temperate as supply and demand come into balance. With mortgage rates flat and inventory picking up, we expect more buyers to take advantage of easing housing market headwinds.”
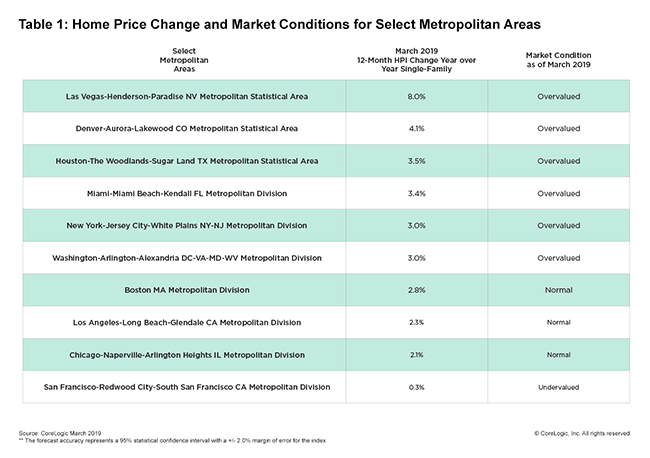
According to the CoreLogic Market Condition Indicators (MCI), an analysis of housing values in the country’s 100 largest metropolitan areas based on housing stock, 35% of metropolitan areas have an overvalued housing market as of March 2019. The MCI analysis categorizes home prices in individual markets as undervalued, at value or overvalued, by comparing home prices to their long-run, sustainable levels, which are supported by local market fundamentals (such as disposable income). Additionally, as of March 2019, 26% of the top 100 metropolitan areas were undervalued, and 39% were at value. When looking at only the top 50 markets based on housing stock, 40% were overvalued, 16% were undervalued and 44% were at value in March 2019. The MCI analysis defines an overvalued housing market as one in which home prices are at least 10% above the long-term, sustainable level. An undervalued housing market is one in which home prices are at least 10% below the sustainable level. During the first quarter of 2019, CoreLogic together with RTi Research of Norwalk, Connecticut, conducted an extensive survey measuring consumer-housing sentiment in high-priced markets. The survey respondents indicated high home prices have an impact on high rental prices as well. Nearly 76% of renters and buyers in high-priced markets agreed housing prices in these markets appeared to be driving rental rates up. “The cost of either buying or renting in expensive markets puts a significant strain on most consumers,” said Frank Martell, president and CEO of CoreLogic. “Nearly half of survey respondents – 44% of renters – cited the cost to rent in high-priced housing markets as the number one barrier to entry into homeownership. This is potentially forcing renters to wait longer to have the necessary down payment in these communities.” The next CoreLogic HPI press release, featuring April 2019 data, will be issued on Tuesday, June 4, 2019 at 8:00 a.m. ET.
|
| © 2006 - 2022. All Rights Reserved. |