Go Back
January Homes Sales Down 2.9% from January 2017
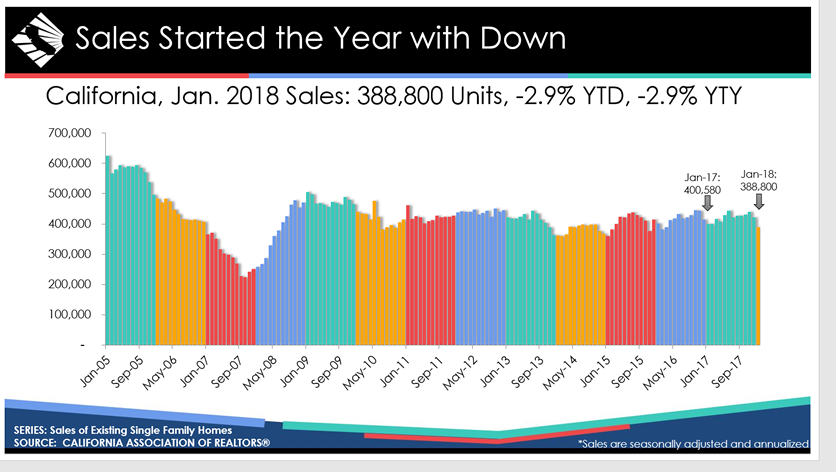
- Existing, single-family home sales totaled 388,800 in January on a seasonally adjusted annualized rate, down 7.6 percent from December and down 2.9 percent from January 2017.
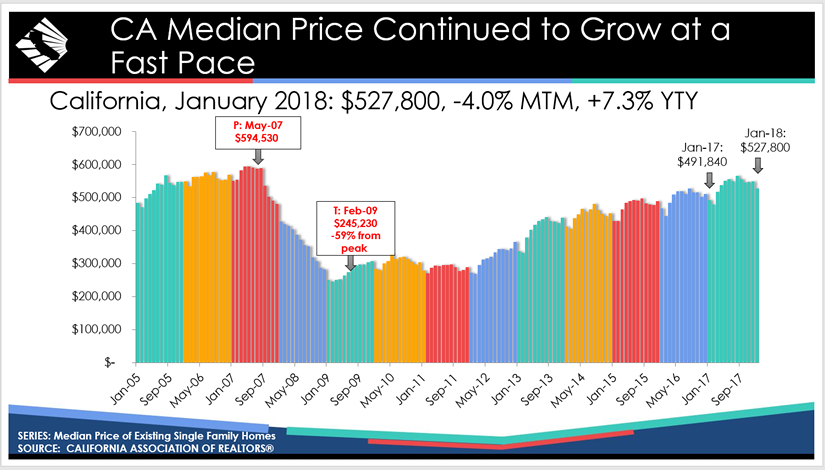
- January’s statewide median home price was $527,800, down 4.0 percent from December and up 7.3 percent from January 2017.
- The most affordable 20 percent of the market now has a median price of $220,000 in California, up more than 10 percent from a year ago, when an entry-level home averaged $200,000.
Following months of defying severe housing inventory shortages and eroding affordability, California’s housing market dropped below the 400,000-level sales benchmark for the first time in nearly two years as sales declined on both a monthly and annual basis, the CALIFORNIA ASSOCIATION OF REALTORS said today.
Closed escrow sales of existing, single-family detached homes in California totaled a seasonally adjusted annualized rate of 388,800 units in January, according to information collected by C.A.R. from more than 90 local REALTOR® associations and MLSs statewide. It marked the first time since March 2016 that the statewide sales figure dropped below 400,000.
The statewide annualized sales figure represents what would be the total number of homes sold during 2018 if sales maintained the January pace throughout the year. It is adjusted to account for seasonal factors that typically influence home sales.
January’s sales figure was down 7.6 percent from the 420,960 level in December and down 2.9 percent compared with home sales in January 2017 of a revised 400,580. The month-to-month decline was the largest in more than two years.
“A persistent shortage of housing inventory and continued affordability crunch is beginning to eat away at the market as buyers struggle to find available homes for sale,” said C.A.R. President Steve White. “As such, we’re seeing a shift in sales toward inland areas such as San Bernardino County in Southern California, and Placer, San Joaquin, Sacramento, and Stanislaus counties, which are all adjacent to the inventory- and price-challenged San Francisco Bay Area.”
The statewide median price continued to grow at a strong pace over last year and remained above the $500,000 mark for the eleventh straight month. The $527,800 January median price was down 4.0 percent from December’s $549,560 and was 7.3 percent higher than the revised $491,840 recorded in January 2017. The year-over-year price gain has been growing at or above 7 percent for seven of the past eight months.
“A tale of two markets continues to be the theme of California’s housing market with the lower end of the market bearing the brunt of the housing shortage as sales of homes priced under $300,000 declined by 17.2 percent from a year ago,” said C.A.R. Senior Vice President and Chief Economist Leslie-Appleton-Young. “At the other end of the spectrum where inventory is less constrained, homes priced $1 million and higher posted solid annual sales gains, especially in the $1.5 million-$2 million range, which jumped 24 percent.”
Other key points from C.A.R.’s January 2018 resale housing report include:
- The Los Angeles metro region experience a 3.6 percent annual sales drop, while sales in the San Francisco Bay Area fell 4.6 percent from last year. The Inland Empire housing market remained flat.
- Home prices across the state continued to grow in general in January. Nineteen counties posted double-digit yearly price increases, and nine counties posted price declines from last year, though prices in Napa and Monterey were mostly flat.
- Prices grew most in markets that had the tightest inventory. For example, nearly half of all the counties with double-digit increases were in the two major employment centers—Southern California and the Bay Area. San Mateo and Santa Clara, already two of the state’s least affordable housing markets, saw home prices surge by at least 25 percent on a year-over-year basis. These parts of the state have both the highest prices and the lowest levels of unsold inventory. In the Central Valley and Central Coast, where inventory is relatively less constrained, price growth averaged in the mid-single-digits.
- Statewide active listings declined in January, dropping 6.6 percent from a year ago. While the number of available listings for sale has trended downward for more than two years, January marked the first time in a year that the listings decline was in the single digits.
- After hitting a 14-year low in December, the available supply of homes bounced back in January, primarily due to seasonal factors, with the statewide unsold inventory index climbing to 3.6 months in January from 2.5 months in December. The index measures the number of months needed to sell the supply of homes on the market at the current sales rate. The index stood at 3.7 months in January 2017.
- The median number of days it took to sell a single-family home remained low at 27 days in January, compared with 36 days in January 2017.
- C.A.R.’s sales price-to-list price ratio* was 98.7 percent statewide in January, 98.7 percent in December, and 98.1 percent in January 2017.
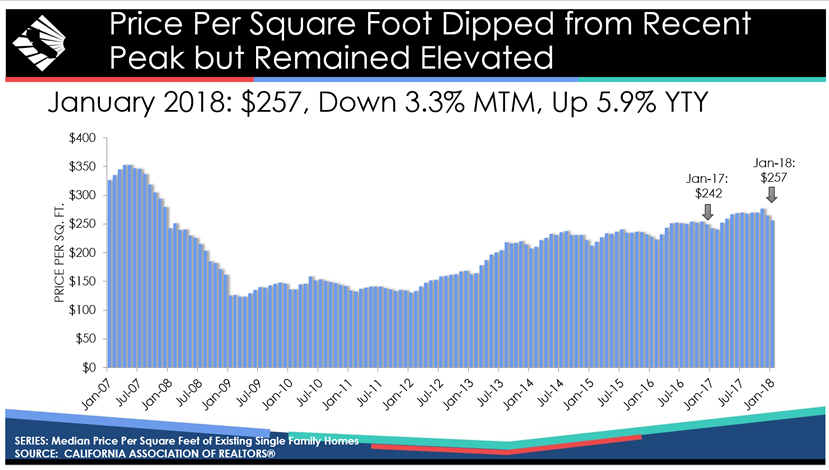
- The average statewide price per square foot for an existing, single-family home statewide was $257 in January, up from $242 in January 2017.
- Mortgage rates broke the 4.0 percent barrier in January as 30-year, fixed-mortgage interest rates averaged 4.03 percent in January, up from 3.95 percent in December but down from 4.15 percent in January 2017, according to Freddie Mac. The five-year, adjustable mortgage interest rate also edged higher in January to an average of 3.47 percent from 3.39 percent in December and from 3.24 percent in January 2017.


